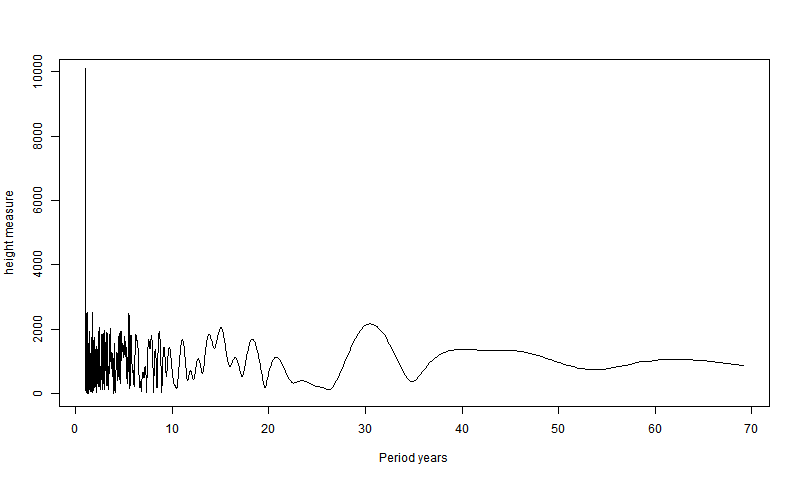
Here is my emulation of Willis's first plot of Stockholm data. It needs an extra factor to match the y-axis units. Contrary to my WUWT comment, I have now padded to 2^16 points.
stock.txt is just the CSV file from Willis's XLS with heading text and lines with just ,,, removed. I've put it here
Here is my R program
v=as.matrix(read.csv("stock.txt"))
a=matrix(NA,227,12)  # First make a mat with 1 row per year
a[v[,1]-1773,]=v[,2:13] # rub out first part with missing years
b=a[-(1:27),]
b=c(t(b))
x=1:length(b)
e=lm(b~x)  # dtrend
b=b-e$fitted #b=a[-(1:27),]
b=c(b,rep(0,2^16-length(b)))  # pad
x=1:length(b)
u=abs(fft(b))  # fft
x=1/x
x=x/min(x)/12  # smallest period 1/12 year
o=x<70 & x>1  # match x-axis and cut VHF
png("tides.png",width=800)
plot(x[o],u[o],ylim=c(0,10000),type="l",xlab="Period years",ylab="height measure")
dev.off()